1
2
3
4
5
6
7
8
9
10
11
12
13
14
15
16
17
18
19
20
21
22
23
24
25
26
27
28
29
30
31
32
33
34
35
36
37
38
39
40
41
42
43
44
45
46
47
48
49
50
51
52
53
54
55
56
57
58
59
60
61
62
63
64
65
66
67
68
69
70
71
72
73
74
75
76
77
78
79
80
81
82
83
84
85
86
| import math
import matplotlib.pyplot as plt
import matplotlib.colors as mcolors
from matplotlib.patches import Rectangle
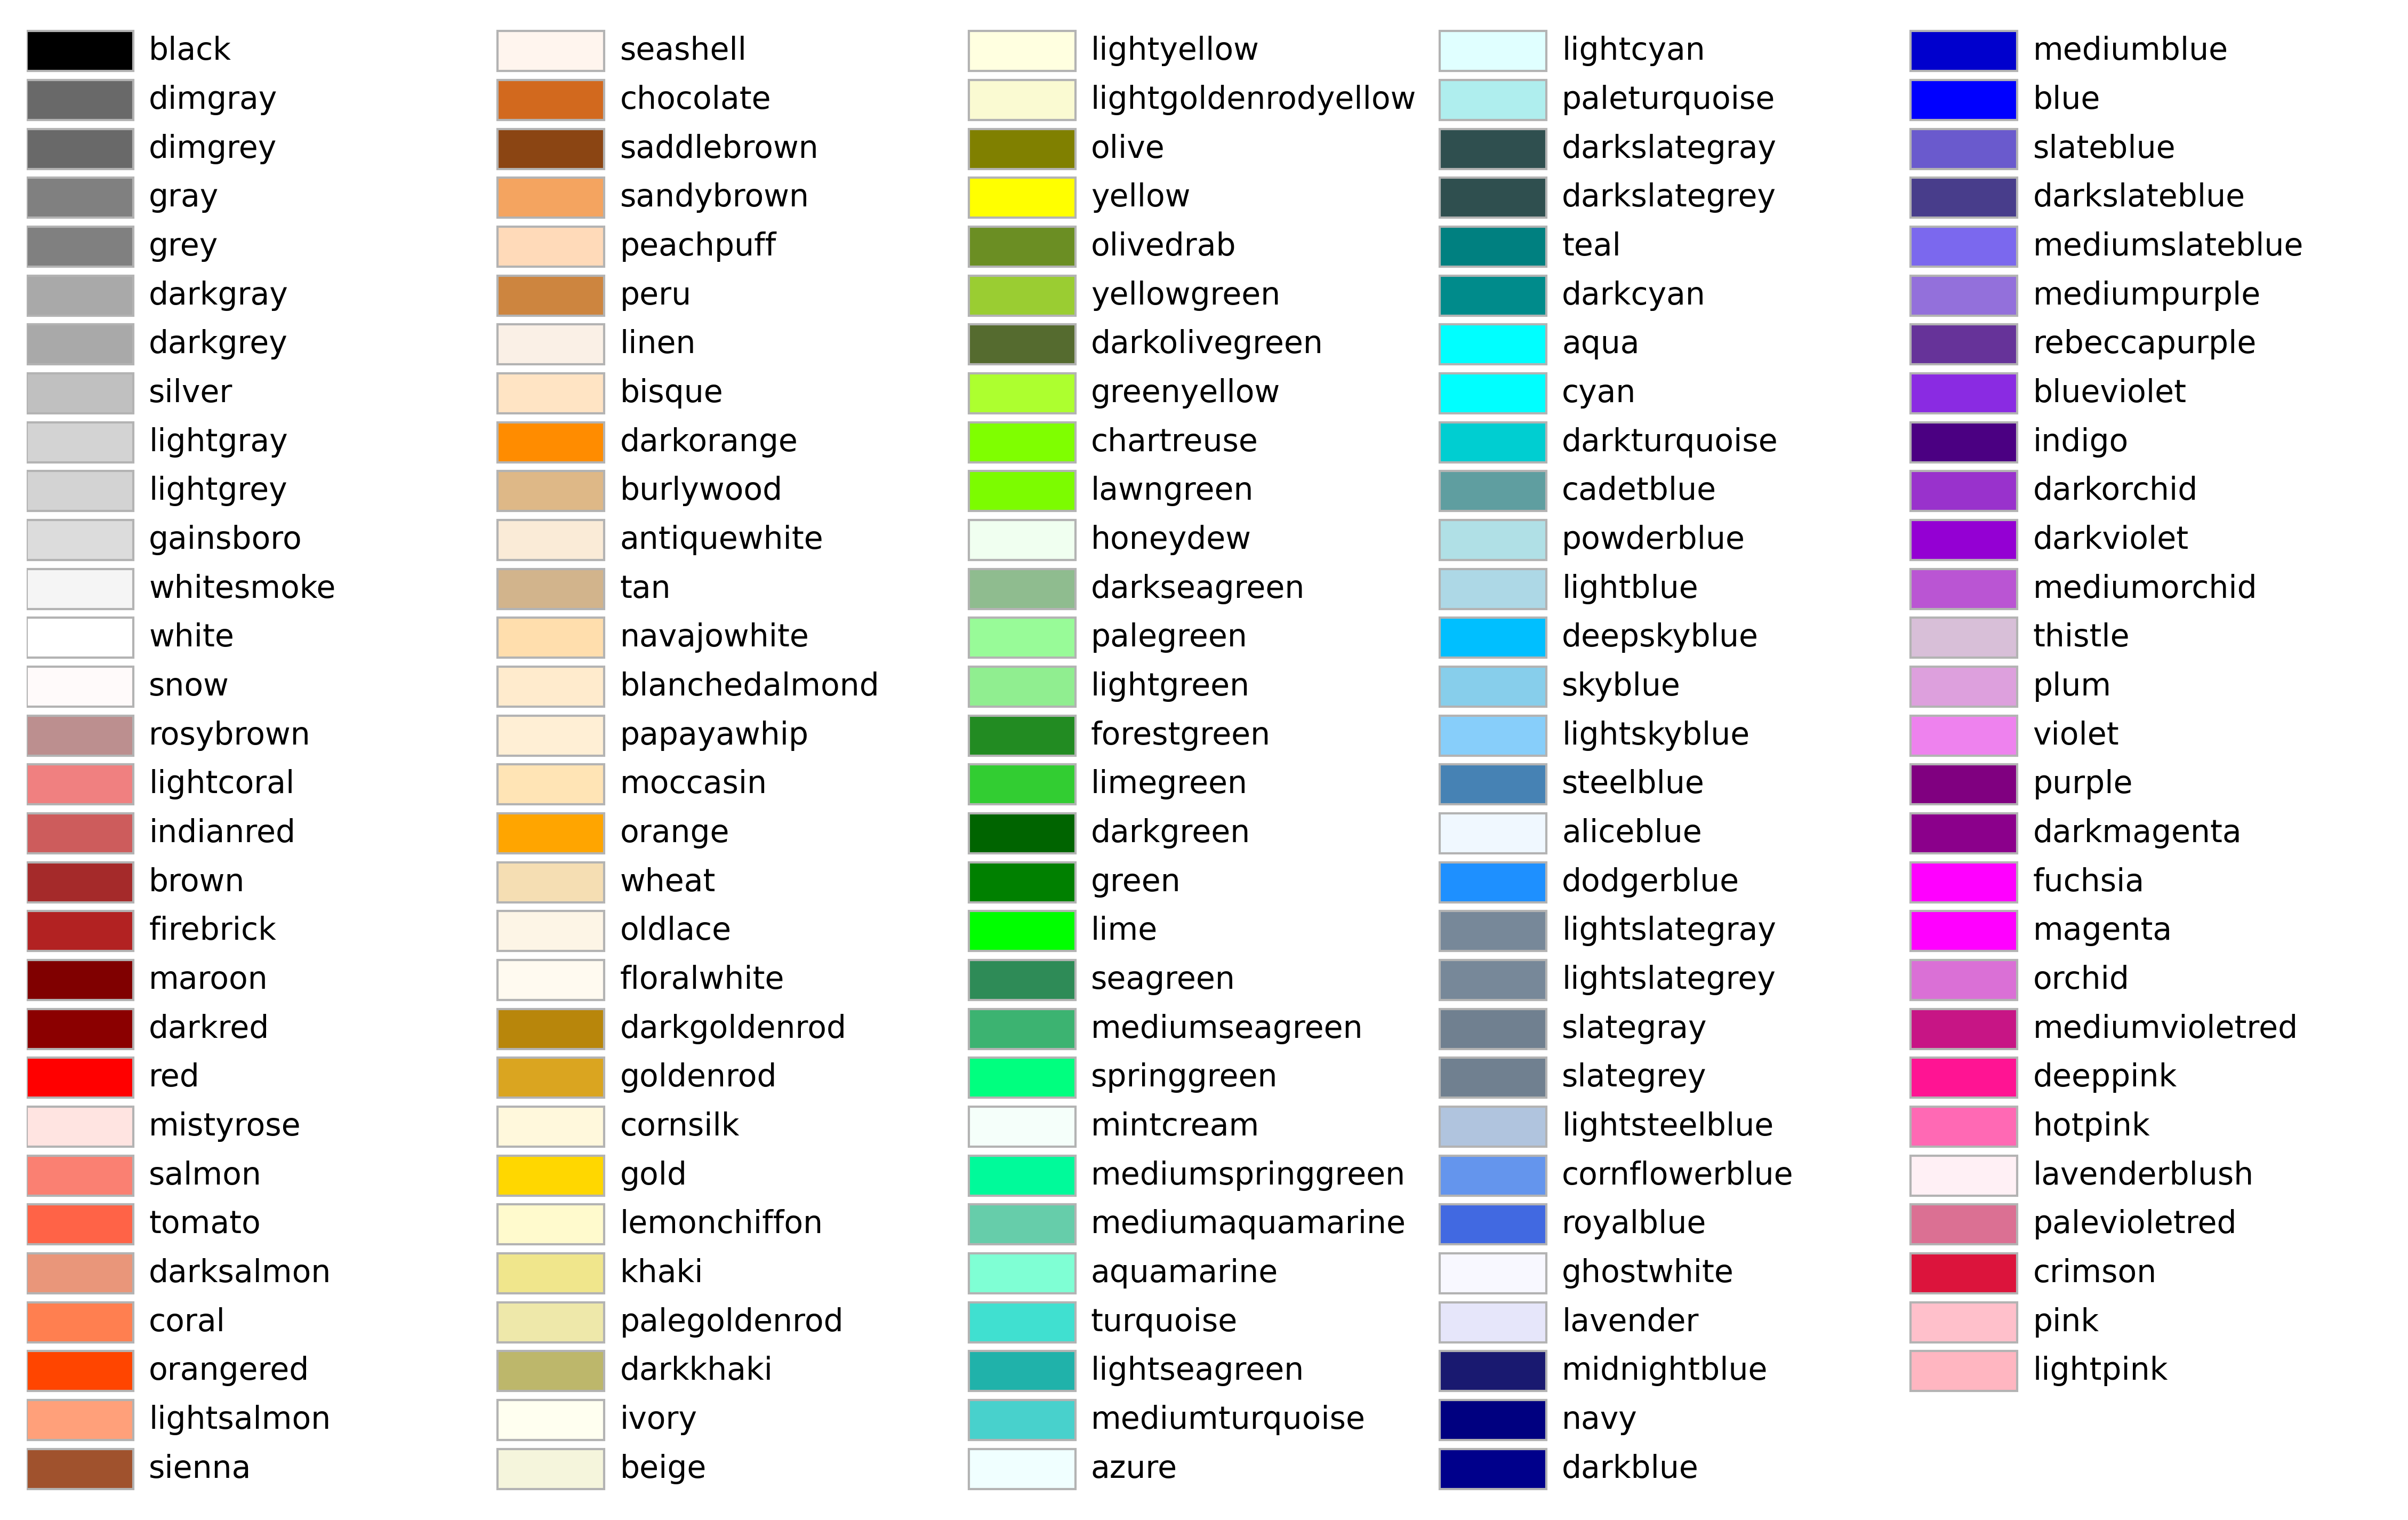
def plot_colortable(colors, *, ncols=4, sort_colors=True):
cell_width = 212
cell_height = 22
swatch_width = 48
margin = 12
if sort_colors is True:
names = sorted(
colors, key=lambda c: tuple(mcolors.rgb_to_hsv(mcolors.to_rgb(c))))
else:
names = list(colors)
n = len(names)
nrows = math.ceil(n / ncols)
width = cell_width * ncols + 2 * margin
height = cell_height * nrows + 2 * margin
dpi = 72
fig, ax = plt.subplots(figsize=(width / dpi, height / dpi), dpi=dpi)
fig.subplots_adjust(margin/width, margin/height,
(width-margin)/width, (height-margin)/height)
ax.set_xlim(0, cell_width * ncols)
ax.set_ylim(cell_height * (nrows-0.5), -cell_height/2.)
ax.yaxis.set_visible(False)
ax.xaxis.set_visible(False)
ax.set_axis_off()
for i, name in enumerate(names):
row = i % nrows
col = i // nrows
y = row * cell_height
swatch_start_x = cell_width * col
text_pos_x = cell_width * col + swatch_width + 7
ax.text(text_pos_x, y, name, fontsize=14,
horizontalalignment='left',
verticalalignment='center')
ax.add_patch(
Rectangle(xy=(swatch_start_x, y-9), width=swatch_width,
height=18, facecolor=colors[name], edgecolor='0.7')
)
return fig
for cl in [mcolors.BASE_COLORS, mcolors.TABLEAU_COLORS, mcolors.CSS4_COLORS, mcolors.XKCD_COLORS]:
print(len(cl))
for (k, v) in mcolors.BASE_COLORS.items():
v = "#" + "".join(format(round(val * 255), "02x") for val in v)
print(f'<font color="{v}"> ████ {k:<10} </font>')
for (k, v) in mcolors.TABLEAU_COLORS.items():
print(f'<font color="{v}"> ████ {k:<10} </font>')
plot_colortable(mcolors.BASE_COLORS, ncols=5, sort_colors=False)
plt.show()
plot_colortable(mcolors.TABLEAU_COLORS, ncols=5, sort_colors=False)
plt.show()
plot_colortable(mcolors.CSS4_COLORS, ncols=10)
plt.show()
plot_colortable(mcolors.XKCD_COLORS, ncols=10)
plt.show()
|